The DIY Data Revolution: Why Investors Are Ditching Traditional Reports for Real-World Clues
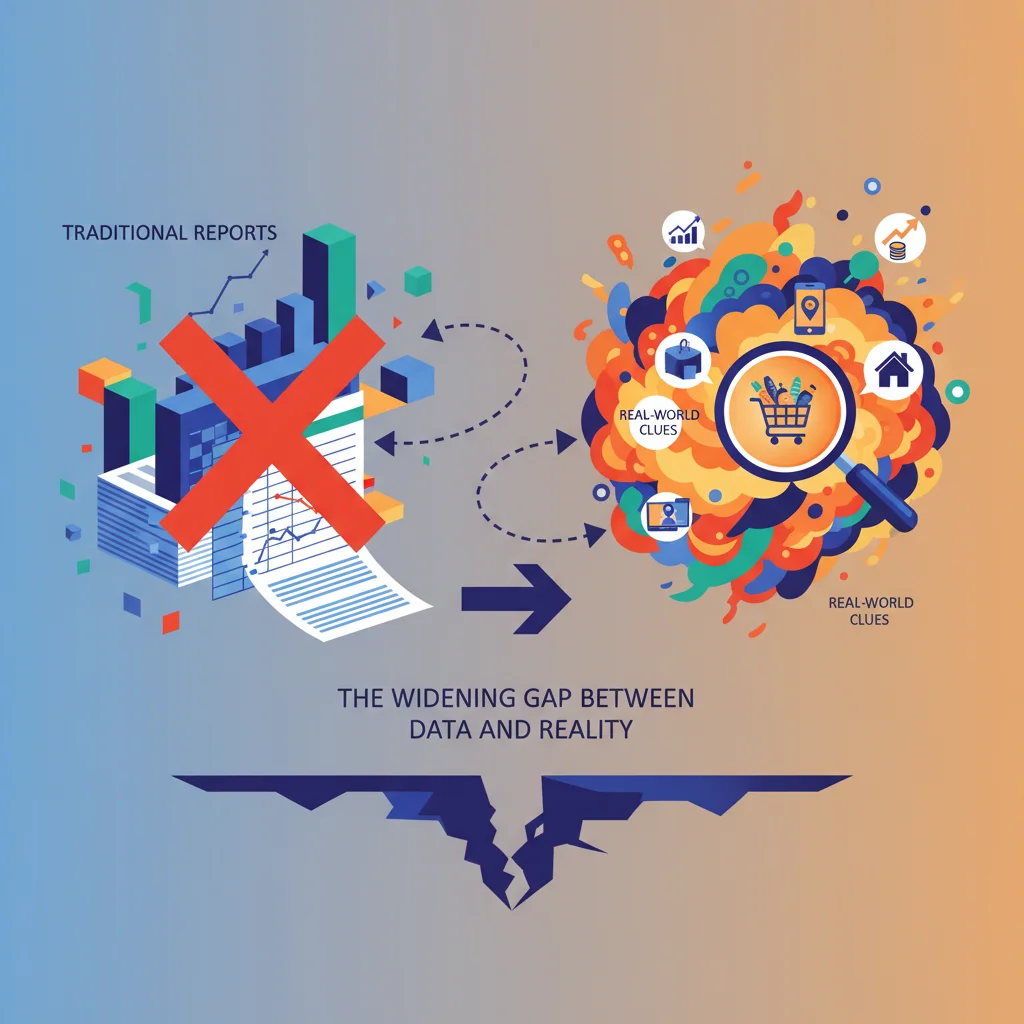
The Widening Gap Between Data and Reality
Have you ever looked at the official inflation report, then glanced at your weekly grocery bill and thought, “These numbers just don’t add up”? You’re not alone. A growing sense of disconnect between official economic statistics and lived experience is fueling a quiet revolution in the world of finance and investing. Professional and retail investors alike are increasingly turning away from traditional data sources, choosing instead to become digital detectives, piecing together their own view of the economy. This is the dawn of the DIY data era.
In a recent discussion on the Financial Times’ Unhedged podcast, hosts Katie Martin and Robert Armstrong delved into this very phenomenon, exploring why investors are taking matters into their own hands. The core issue is a crisis of confidence. Official economic data, while essential, often comes with significant lag. By the time we get last quarter’s GDP figures or last month’s employment report, market conditions may have already shifted dramatically. Furthermore, these numbers are frequently revised, sometimes substantially, which can undermine their credibility as a reliable tool for real-time decision-making.
This isn’t just about impatience; it’s about seeking a more granular, high-frequency understanding of the economic machine. When the world is changing at breakneck speed, waiting for the official scorecard feels like driving while looking only in the rearview mirror. This fundamental challenge has paved the way for a new approach to financial technology and analysis, one that prioritizes immediacy and on-the-ground evidence over staid, historical reports.
The Investor’s New Toolkit: What is DIY Data?
So, what exactly does this “DIY data”—often called “alternative data” in professional circles—look like? It’s a broad and innovative field that involves gathering and analyzing information from unconventional sources to gain an edge in trading and investment. It’s about finding proxies for economic activity that are faster, more direct, and sometimes more accurate than what government agencies can provide. This movement is powered by advancements in financial technology (fintech), which have made collecting and processing vast amounts of information more accessible than ever before.
The goal is to answer critical questions before the rest of the market: Are consumers really spending? Are supply chains clearing up? Is a company’s new product flying off the shelves? Below is a look at some of the common types of DIY data being used today to get a real-time pulse on the economy.
| Data Type | Source | What It Can Indicate |
|---|---|---|
| Satellite Imagery | Commercial satellite providers (e.g., Planet Labs) | Retail foot traffic (parking lot density), factory output (thermal imaging), commodity supply (oil tanker locations, crop health). |
| Credit/Debit Card Transactions | Anonymized data aggregators | Real-time consumer spending trends at specific companies or across entire sectors, providing an early read on company earnings. |
| Web Scraping & Social Media Sentiment | Automated bots, public APIs | Product price changes, hiring trends (from job postings), public perception of a brand, and overall market sentiment. |
| Geolocation Data | Anonymized mobile phone data | Foot traffic patterns to stores, restaurants, and theme parks; changes in commute times as a proxy for return-to-office trends. |
| Shipping & Logistics Data | Port authorities, customs data, GPS tracking | Global trade flows, supply chain bottlenecks, and the movement of goods, which can predict inventory levels and sales. |
This shift represents a fundamental change in how financial analysis is conducted. For decades, the playing field was dominated by those with privileged access to management or expensive Wall Street research. Today, an investor with the right skills and tools can, in theory, build a more accurate picture of a company’s performance than a traditional analyst relying on quarterly calls. As Robert Armstrong noted, the appeal is in creating a “mosaic of reality” from these disparate pieces of information (source).
The Knotweed of Finance: Is Cryptocurrency an Invasive Species in Your Portfolio?
From Theory to Trading: The Impact on the Stock Market
The use of alternative data isn’t just an academic exercise; it’s actively reshaping trading strategies across the stock market. Hedge funds and quantitative trading firms have been the pioneers in this space for years, spending millions to acquire exclusive datasets that give them a fractional-second advantage. They might, for example, analyze satellite images of a major retailer’s parking lots in the weeks leading up to an earnings report. If the lots are consistently fuller than last quarter, it could signal a potential earnings beat, prompting them to buy the stock before the official news breaks.
What’s changing is that these techniques are no longer the exclusive domain of elite quants. Fintech platforms are emerging that package and sell alternative data streams to a wider audience, including smaller institutional investors and even sophisticated retail traders. This has profound implications for the market. The “information advantage” that a piece of data provides shrinks as more people gain access to it. The market becomes more efficient, but the hunt for a true, sustainable edge becomes exponentially harder.
Moreover, this trend forces a change in the banking and corporate world. Companies must now assume that their every move—from the number of job postings on their website to the flight logs of their corporate jets—is being scrutinized in real-time. This “data exhaust” is now a key part of the investment mosaic, whether they like it or not. The traditional quarterly earnings cycle, a cornerstone of financial reporting, starts to look archaic in a world of daily, or even hourly, performance indicators (source).
The Quantum Leap: Why Today's Financial Markets Are on the Brink of a Sci-Fi Revolution
The Dark Side: Pitfalls and Perils of the Data Gold Rush
While the promise of DIY data is alluring, the practice is riddled with challenges that can easily trip up the unwary. The first and most significant is the danger of misinterpretation. A dataset might be noisy, incomplete, or biased. For example, credit card data might over-represent certain demographics or exclude cash transactions, leading to a skewed view of a company’s customer base.
Secondly, there are significant ethical and privacy concerns. The use of geolocation and transaction data, even when “anonymized,” raises important questions about surveillance and consent. As regulations like GDPR and CCPA become more stringent, the availability and legality of certain datasets could change overnight, posing a risk to any investment strategy built upon them.
Finally, there’s the simple fact that a strong correlation does not imply causation. An investor might find a dataset that perfectly predicted a stock’s movement for the past three years. But was it a genuine economic link or pure coincidence? Back-testing a strategy on historical data is one thing; having it work in the unpredictable future is another entirely. Without a deep understanding of statistics and a healthy dose of skepticism, DIY data can be more dangerous than having no data at all.
The Future of Financial Analysis: A Hybrid Approach
Is traditional economic analysis dead? Far from it. The future of investing and economics doesn’t belong to the DIY data evangelists or the old-school traditionalists alone. It belongs to those who can build a hybrid model, synthesizing the high-frequency signals from alternative data with the macroeconomic context provided by traditional analysis.
The role of a skilled analyst is evolving from a data regurgitator to a data interpreter. The most valuable skill will be the ability to weave a coherent narrative from multiple, often conflicting, data streams. This is where technologies like AI and machine learning will become indispensable, helping to process unstructured data and identify meaningful patterns that a human might miss. Looking further ahead, technologies like the blockchain could offer a new frontier for data integrity, providing transparent and tamper-proof records for everything from supply chain movements to financial transactions.
The DIY data revolution is a direct response to a world of accelerating complexity. It’s a testament to human ingenuity and the relentless pursuit of an edge in the competitive arena of the financial markets. For investors, the message is clear: stay curious, but be critical. For business leaders, the takeaway is that your company is more transparent than ever before. In this new era, the data never lies—but it can be easily misunderstood.
The AI Bubble: Are We Repeating History's Costliest Financial Mistakes?
Related Posts

Beyond the Podium: Decoding the Economic Tremors of a Presidential Address

Beyond the Balance Sheet: Why a Local Florist’s Success is a Major Signal for the Stock Market